MATLAB: boxplot and isoutlier disagree about outliers
September 24, 2019
TL;DR: isoutlier classifies outliers based on scaled mean absolute
deviations, while boxplot is based on interquartile range.
Suppose I have some data in an N by 10 array and pass it to matlab’s
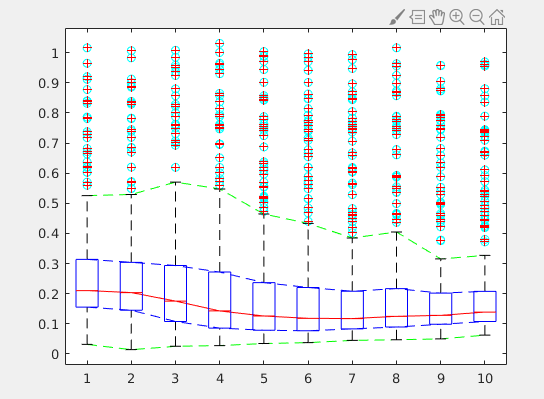
boxplot. By default, I get

Suppose I want to extract the statistics that MATLAB uses to generate the plot. According to the documentation
the central mark indicates the median, and the bottom and top edges of the box indicate the 25th and 75th percentiles, respectively. The whiskers extend to the most extreme data points not considered outliers, and the outliers are plotted individually using the ‘+’ symbol.
Using simple MATLAB built-ins I might then write
function [q1,q2,q3,w0,w1,outliers] = boxplot_statistics(data)

    % quantile(data,3) will return the 25th, 50th, and 75th percentile
    % for each column
    quants = quantile(data, 3);
    q1 = quants(1,:);
    q2 = quants(2,:);
    q3 = quants(3,:);

    % outliers will return a logical array where true indicates outliers
    % (outlier are computed per column)
    outliers = isoutlier(data);

    % To compute the whiskers, take max and min (per column). Setting
    % outlier values to NaN causes them to be ignored.
    data(outliers) = NaN;
    w0 = min(data,[],1);
    w1 = max(data,[],1);
end
But here is the result.

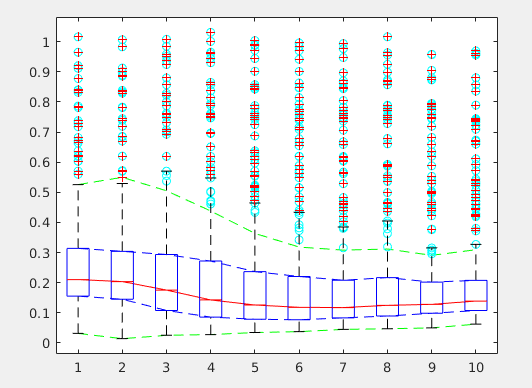
I’ve plotted the predicted tops and bottoms of the boxes in blue, the medians in red, the whiskers in green, and the outliers in cyan. Notice how the predicted outliers (cyan) drop below the actual whisker in several places (and as a result the predicted upper whisker (green) is also too low).
What gives?
Digging deeper into the boxplot documentation, there is a parameter
‘Whisker’ with default value 1.5:
Maximum whisker length, specified as the comma-separated pair consisting of ‘Whisker’ and a positive numeric value.
boxplotdraws points as outliers if they are greater thanq3 + w × (q3 – q1)or less thanq1 – w × (q3 – q1)
Hence, boxplot classifies outliers as those values that are w
quartile ranges above the upper quartile or below the lower quartile.
On the other hand, isoutlier classifies points as outliers if they are
more than 3 scaled median absolute deviations from the median.
It turns out that if w = 1.5 we can achieve the same outlier
classification with isoutlier(data, 'quartile').
However, if we choose a custom value for the Whisker parameter, we’d
like to be able to handle that too. Hence the final answer is:
